Module 3. Mainstreaming the SDGs
Using indicators and disaggregated data
Using indicators and disaggregated data for localization of SDGs involves analyzing and interpreting data at a granular level to identify specific challenges and tailor interventions to specific regions or population groups. With the central tenet of Agenda2030 being “leave no one behind”, identifying what groups are affected in different ways is central to ensuring that development plans is not carried out to marginalised groups’ disadvantage.
What is disaggregated data?
“Disaggregated data is data that has been broken down by detailed sub-categories, for example by marginalised group, gender, region or level of education. Disaggregated data can reveal deprivations and inequalities that may not be fully reflected in aggregated data”. (source)
GDP is an example of when data on a national level (aggregated) gives a misrepresenting image of inequalities that exist within a country. By disaggregating that data between gender, area, education levels, ethnic heritage, etc, we get a much more nuanced picture which allows is to identify problems and tailor solutions.
Here’s an explanation on how to utilise disaggregated data for SDG localization:
- Identify relevant indicators: Each SDG has associated targets, and in turn, these targets each have specific indicators that measure progress towards achieving them. These indicators can be measured using different data sources, such as surveys, administrative records, or remote sensing. Identify the indicators that are most relevant to the specific local context you are working with.
- Collect disaggregated statistics: Disaggregating breaks down data by specific characteristics such as age, gender, or geographic location, and can help identify needs and inequalities within a population. By collecting disaggregated data, you can identify disparities and inequalities within a given area or population group. It helps to understand who is being left behind and design targeted interventions. needs. It is important to ensure that indicators and statistics are collected and analyzed in a transparent and consistent manner, using internationally agreed upon methodologies and standards. This helps ensure that the data is reliable and can be compared across different contexts.
- Visualize the data: Use data visualization techniques to present the findings in a clear and accessible manner. Visualizations such as charts, graphs, and maps can effectively communicate complex information and make it easier for all stakeholders to understand the localized challenges and prioritize actions.
- Advocate for localized action: Utilize the statistical evidence along with qualitative analysis to advocate for targeted localized action on the SDGs. By highlighting specific issues and disparities, you can engage more policymakers, community leaders, and other stakeholders to develop targeted interventions and policies that address the unique challenges faced by specific regions or population groups.
- Monitor progress and adjust interventions: Regularly monitor progress towards the SDGs using updated disaggregated data. Track changes over time and assess the effectiveness of interventions. If certain approaches are not yielding the desired results, consider adjusting strategies based on the data insights to ensure maximum impact and progress towards achieving the SDGs. See more on monitoring progress in Module 4 of this course.
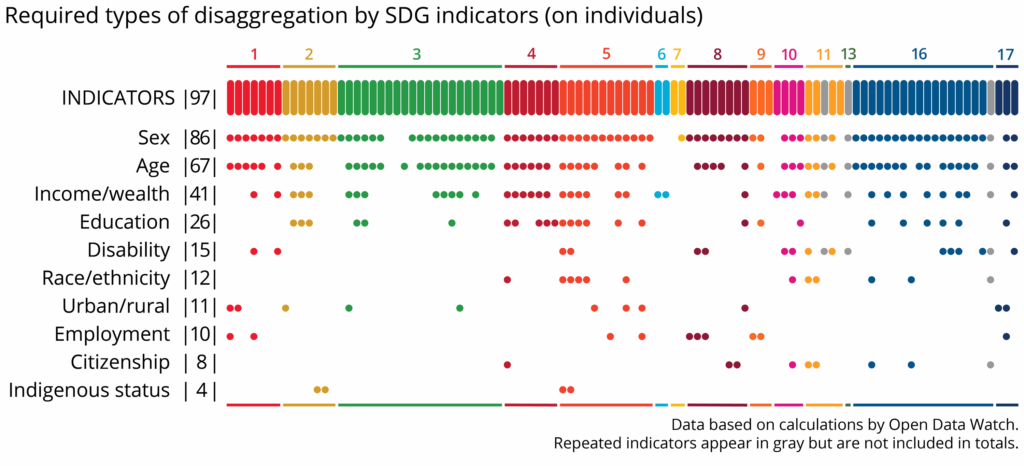
This graphic by Open Data Watch estimates of what type of data is needed to properly work with the different goals.
Access to data differ between municipalities. It is a good idea to investigate the availability of municipal data in your local government – sometimes central statistics entities have detailed databanks but it is good to keep a critical eye to what data points are not included. Your stakeholder analysis will inform your critical thinking here!
Note: Data is not everything, and indicators are not always the best tool to capture a nuanced reality. You may ask yourself: How do I know what I think I know? Some SDG indicators can be answered by statistical and quantitative data, whereas cultural practices, structures and perceptions often must be understood through qualitative narratives or observation.
Remember the video on how to implement SDG 5 on gender equality? Gender mainstreaming and progress on several of the targets connected to SDG 5 is based on analysis of gender-disaggregated data which shows how men and women, boys and girls are affected differently by various phenomena, measures and policies. If you haven’t, consult the the toolbox for Local Governments to implement SDG#5 on Gender Equality.
Both these last points make a strong argument for proper engagement with the target communities. Hence, then next section is about stakeholder engagement.